Revolutionizing Observability with New Relic
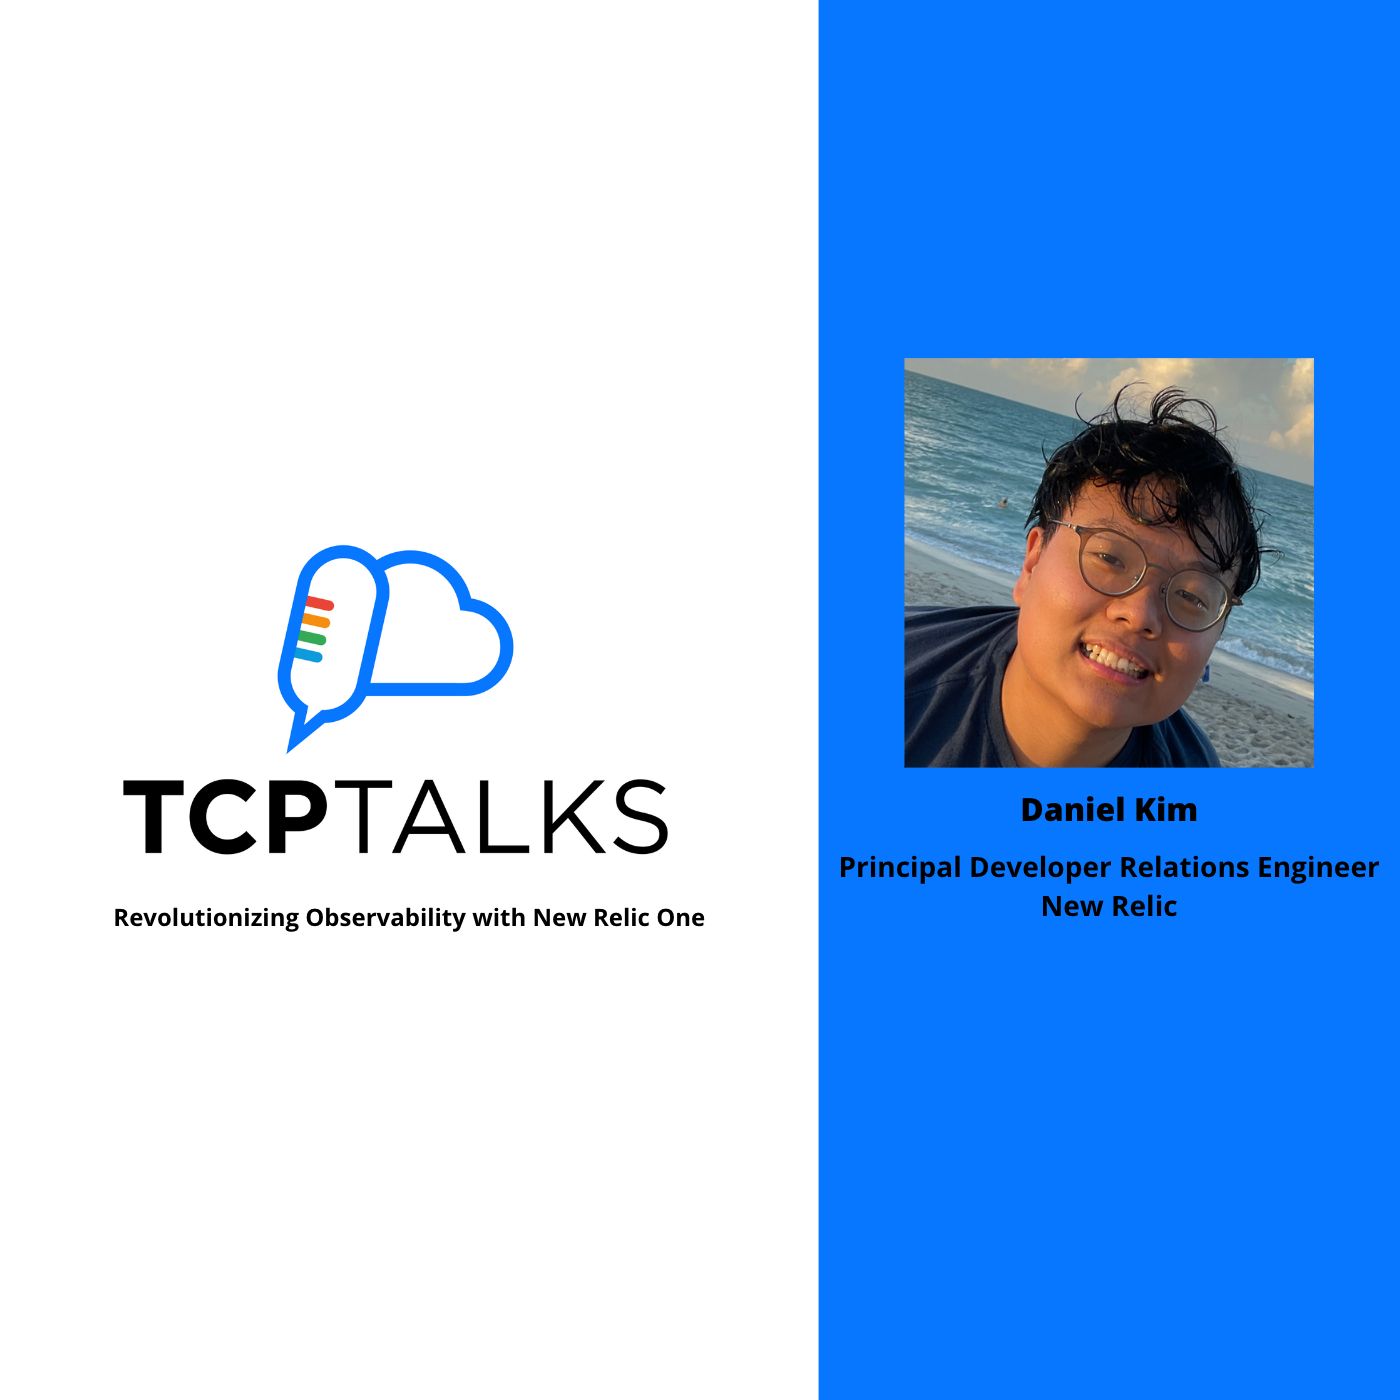
In this episode, Daniel explains a new strategy towards observability aimed at contextualizing large volumes of data to make it easier for users to identify the root cause of problems with their systems.
Daniel Kim is a Principal Developer Relations Engineer at New Relic and the founder of Bit Project, a 501(c)(3) nonprofit dedicated to making tech accessible to under-served communities. His job is basically to get developers excited about Observability, and he hopes to inspire students to maximize their potential in tech through inclusive, accessible developer education. He is passionate about diversity and inclusion in tech, good food, and dad jokes.
Show Notes
First, it is important to differentiate between monitoring and observability. Monitoring is basically when a code is instrumented to send data to a backend, to give answers to preconceived questions. With Observability, the goal is to monitor your system so as to later ask questions that were not in mind during the instrumentation of the system. Hence, if something new comes up you can find the root cause without modifying the code. There are so many levels of things to check when troubleshooting to find the cause of a problem, and this is where observability comes in.
There are different use cases for logs, metrics, and traces; Logs are files that record events, warnings, or errors however logs are ephemeral which means there is increased risk of losing a lot of data. A system needs to be in place to move logs to a central source. Another issue with logs is that it is poorly structured data. Logs are good to have as the last step of observability. Metrics and traces can however help to narrow down where to search in the logs to solve an issue.
Metrics are measurements that reflect the performance or health of your applications. They give an overview of how the systems are doing but tend to not be very specific in finding the root cause of a problem; other forms of data have to be adopted to get a clear picture. This is where Traces come in.
Traces are pieces of data that track a request as it goes through the system. Because of this, they can identify the root cause of an error or bottlenecks slowing down the system. However, they are very expensive and as such sampling is used when tracing but this reduces the accuracy of traces. Correlating information from logs, metrics, and traces gives a full clear picture for debugging to be carried out successfully. A lot of New Relic customers strive to get more pieces of data to get errors faster.
To balance the right data at the right time with the right cost, the first step when collecting large amounts of data is to find out how your organization is leveraging the data. A quick audit of the data to identify useful data is helpful. This can be done monthly or quarterly. Unstructured logs are difficult to aggregate
In the cloud native space, being able to be compatible with as many people as possible will determine the winners because there are many projects people use in production. Projects that are compatible with many other projects are the way forward.
APM is still very useful to understand application performance and in the future, data from all sources will be correlated to figure out the cause of a problem. Getting value very early from the system involves having a solid infrastructure and installing APM. The real power of full stack observability is getting data from different parts of your stack so you can diagnose what part of your system is going wrong. Leveraging AI to make sense of large amounts of data for engineers is going to be a huge plus.
A lot of vendors claim that their alert systems will automatically generate all alerts for you but this is not true because they would not know your team’s needs. It is ultimately up to your team to set up alerts that create an observability strategy. Those who invest time into setting this up get the most ROI from New Relic. Engineers need to figure out what metrics are important to them.
About New Relic One:
This was made to be a singular observability platform where people can correlate various pieces of data to get more context making the work easy for engineers. The goal was to help engineers to find the information they need as fast as possible, especially during a crisis.
This kind of third-party solution is much more applicable for processing millions of logs or larger data, compared to native tools. It also provides a large amount of expertise around observability and curated experiences around machine-generated data.
The future seems to have customers tilting towards open-source observability solutions. OpenTelemetry is one example of this, as it brings together all observability offerings in open source in a whole stack observability experience.
Visit the New Relic website to learn more about it. To learn more about ways to use New Relic, check out the New Relic Blogs.
Top Quotes
- 💡 “Having so much data and information about your system, you’re able to quickly figure and rule out issues that you may be having that’s causing the issue”
- 💡 “A really good practice when we think about controlling cost is getting a really good idea of how you’re actually using the data that you’re collecting”
- 💡 “Having structured logs is really helpful when we’re talking about observability”
- 💡 “Something that I’ve realized in the tenure that I’ve been working in observability is that when something sounds too good to be true, it probably is”


